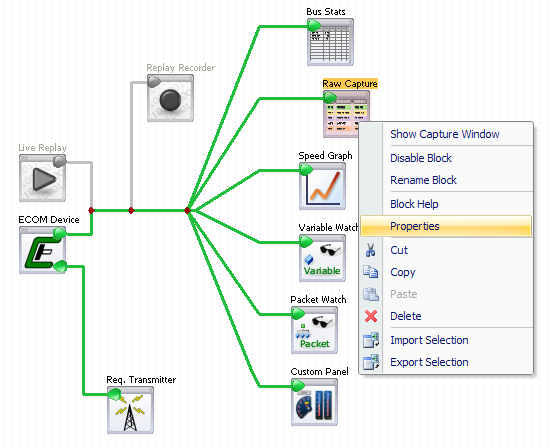
Flexible Data Flow Chart
 CANCapture uses a graphical data flow chart as its centralized location for managing and controlling the program's behavior. The flow chart is used to visually control the flow of CAN traffic in and out of various Functional Blocks which can each handle, interpret, and react to data in unique ways. The flow chart is highly flexible, allowing one to freely manipulate blocks and draw interconnects at any time (before or during a "live" capture) and in any way.
- Completely flexible - add unlimited function blocks anywhere on the grid and join them with interconnect lines that can be branched and connected in any way. Interconnect lines turn green to easily identify when they are properly connected.
- The flow chart can be manipulated during a "live" capture and will immediately respond to changes. There's no need to stop a session just to change the data flow.
- Each block corresponds to its respective window (or panel), which can be renamed, disabled, focused, or removed all from the chart.
- Cut, copy, and paste support as well as an import and export feature for saving and sharing configurations with others; for example, you can easily export your list of transmit messages or a custom packet filter to share with a colleague.

