Graph Block
 The graph block is used to plot any variable in the CAN database; as each variable is received, it is plotted in real-time in the graph window. The graph was developed completely from scratch with the sole purpose of being able to handle streaming data with a moving time axis. Due to its tuned development efforts and focus on performance, there is not a graphing tool available that is smoother or better suited for real-time streaming data; response and display time is instant.
 Graph features:
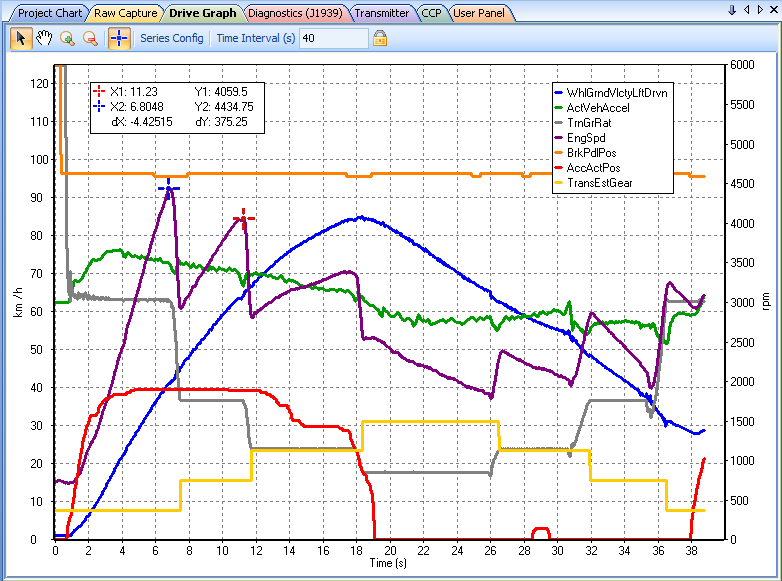
- Unlimited series with smooth, responsive operation
- Zoom-in, zoom-out, and pan automatically using the mouse
- Individual control of series color, scaling, size, and type
- Measurements between points in both the x and y axis using built-in cursors
- Select a time-interval for an auto-scrolling time window as new data arrive